


Zhen Zeng, PhD
BJS Statistician
September 2026
NCJ 311504


Introduction
At midyear 2024, local jails held 658,700 persons in custody, similar to midyear 2023 (664,200) but a 12% decrease from the inmate population in 2014 (744,600) (display 1). The jail incarceration rate was 194 per 100,000 U.S. residents in 2024, down 17% from 234 inmates per 100,000 in 2014. From July 2023 through June 2024, local jails nationwide reported 7.9 million admissions, 4% higher than the 7.6 million in 2023 but 31% lower than the 11.5 million admissions in 2014. The average daily population (ADP) was 667,700 persons during this period, nearly unchanged from 2023 (664,800) but down 10% from 2014 (739,000).
Highlights
- The ADP in 2024 was 667,700 persons, nearly unchanged from 664,800 in 2023 but down 10% from 739,000 in 2014 (display 1).
- Annual jail admissions totaled 7.9 million persons, up 4% from 7.6 million in 2023 but down 31% from the 11.5 million jail admissions in 2014 (display 1).
- From 2020 to 2024, the number of persons age 65 or older in jail increased by 80%, from 7,400 to 13,300 (display 4).
- At midyear 2024, the jail incarceration rate for black persons was 566 per 100,000 U.S. residents, four times the rate of incarceration for white persons (149 per 100,000) (display 10).
- At midyear 2024, 68% of jail inmates were unconvicted, down from a peak of 71% in 2021 but up from 59% at midyear 2014 (display 11).
- From 2015 to 2024, the number of inmates held for a misdemeanor declined by 37% while felony holds remained stable (display 12).
- From July 2023 to June 2024, persons admitted to jail spent an average of 31 days before release, down from 32 days in the prior year and up from 25 days in 2015 (display 17).
About this report
Findings in this report are based on the 2014–2018 and 2020–2023 Annual Survey of Jails (ASJ) and the 2019 and 2024 Census of Jails (COJ). Inmate population counts are based on the last weekday in June (midyear). See Methodology for more information about reference periods, study design, and data collections. The forthcoming public-use 2024 COJ data file will be available for download at the National Archive of Criminal Justice Data..
In December 2025, BJS published Preliminary Data Release — Jails (2024). This web report provides an update to the preliminary release.
This web report is optimized for viewing on desktops. Use the navigation bar to skip to specific sections. Move the mouse over statistics in displays to see details. Download displays as images by clicking on the link below each display or download as comma-delimited files in the Download data tables section. Additional views are available for some displays and can be accessed by selecting a view from the dropdown list to the right of the table title.
Jail populations by state
Jail populations and incarceration rates varied by state in 2024. The largest midyear jail populations were reported in Texas (73,100), California (58,800), Florida (56,400), and Georgia (43,300) (display 2). Together, these four states accounted for more than one-third of all persons held in local jails nationwide. The five highest incarceration rates were reported in Louisiana (670 inmates per 100,000 residents), Kentucky (457), Mississippi (446), Georgia (388), and Tennessee (376), while the lowest rates were reported in Massachusetts (102), New Jersey (95), New Hampshire (92), Minnesota (89) and New York (85).
Demographic characteristics of inmates
At midyear 2024, local jails housed 95,200 females, representing 14% of the total inmate population (display 3). The female inmate population was similar to midyear 2023 (95,100) but was 11% lower than in 2014 (107,200).
From 2020 to 2024, the number of incarcerated adults age 65 or older in jails increased by 80%, from 7,400 to 13,300 (display 4). The number of incarcerated adults ages 35 to 64 increased by 37%, from 246,800 to 337,300.
At midyear 2024, 2,400 persons age 17 or younger were incarcerated in local jails (display 5). This represents a 23% increase from 2,000 juveniles at midyear 2023 but a decrease of 41% from midyear 2014 (4,100).
At midyear 2024, 45% of incarcerated persons were white (297,900), 38% were black (247,600), and 15% were Hispanic (97,400) (display 6). Other racial and ethnic groups, including American Indian or Alaska Native persons, Asian persons, Native Hawaiian or Other Pacific Islander persons, and those identifying with two or more races, collectively made up 2% of the total jail population.
At midyear 2024, females accounted for 19% of the white jail population and 10% of the black and Hispanic jail populations (display 7).
Jail incarceration rates
At midyear 2024, there were 194 persons incarcerated in jail per 100,000 U.S. residents, down 17% from 234 inmates per 100,000 at midyear 2014 (display 8). The male incarceration rate was 335 per 100,000, more than six times the rate of incarceration for females at 55 per 100,000.
At midyear 2024, adults ages 25 to 34 had the highest incarceration rate at 450 per 100,000 U.S. residents, 20 times the rate for those age 65 or older (22 per 100,000) (display 9).
From 2020 to 2024, jail incarceration rates declined for persons ages 18 to 24 but increased for all other adult age groups, with the sharpest rises among older adults: up 62% for age 65 or older, 46% for ages 55 to 64, and 40% for ages 45 to 54.
At midyear 2024, the incarceration rate for black U.S. residents was 566 per 100,000 U.S. residents, four times the rate for white U.S. residents (149 per 100,000) (display 10). American Indian or Alaska Native persons had the second-highest rate at 374 per 100,000. Hispanic persons were incarcerated at a rate comparable to white persons (141 per 100,000).
Conviction status and offense characteristics
At midyear 2024, 68% of jail inmates (450,700) were unconvicted, either awaiting court action on a current charge or being held in jail for other reasons (display 11). The remaining 32% (208,000) were convicted, either serving a sentence or awaiting sentencing. From 2023 to 2024, the number of unconvicted persons decreased 3.6%, from 467,600 to 450,700, marking the first year-to-year decline since 2020. The percentage of unconvicted persons increased from 59% in 2014 to 68% in 2024, after peaking at 71% in 2021.
At midyear 2024, 76% of inmates were held for felony offenses, marking an increase from 68% in midyear 2015 (display 12). Inmates being held for misdemeanors (19% or 121,900) and other offenses (6% or 36,700) made up the remainder. The number of inmates being held for a misdemeanor offense at midyear 2024 decreased 37% from 2015 (192,900).
Local jails also play a role in supervising persons who violate conditions of community supervision (display 13). At midyear 2024, local jails held 105,900 persons for probation violations, a 10% increase from midyear 2023 (96,100). Local jails held an additional 29,200 for parole violations at midyear 2024.
Persons held for federal, state, or tribal authorities
At midyear 2024, local jails housed 128,400 inmates for federal, state, tribal, and other local jail jurisdictions, an 11% increase from midyear 2023 (115,700) (display 14).
Of those held for outside jurisdictions in 2024, 41,900 inmates were held for federal authorities (33%), 55,600 for state prison authorities (43%), and 1,300 for tribal governments (1%). Persons held for state authorities increased by 15% from the prior year (48,400).
The number of persons held in local jails for U.S. Immigration and Customs Enforcement decreased by 51% from midyear 2014 (16,400) to midyear 2024 (8,000).
Average daily population, admissions, and average time in jail
From 2015 to 2024, males accounted for about 85% of the ADP (display 15).
From 2015 to 2024, females accounted for 1 in 4 of the total admissions to local jails each year (display 16). During this period, male admissions declined 27%, from 8,254,000 to 6,059,000, while female admissions declined 22% from 2,430,000 to 1,885,000.
From July 2023 to June 2024, persons admitted to local jails spent an average of 31 days in custody before release, approximately 1 day shorter than the year prior (32 days) but 6 days longer than the average stay in 2015 (25 days) (display 17).
From July 2023 to June 2024, male inmates were detained on average for 35 days in jail before release, almost twice as long as female inmates (19 days).
On average, persons admitted to jail jurisdictions with an ADP of 2,500 or more inmates were detained 43 days, nearly twice as long as those admitted to jails with ADPs of 50–99 inmates (22 days) and four times as long as those admitted to jails with an ADP of fewer than 50 (11 days) (display 18).
Capacity and staffing
At midyear 2024, local jails had 910,600 beds, with 72% occupied, similar to midyear 2023 (73%) but below the 2014 occupancy rate (84%) (display 19). From 2014 to 2024, the percentage of jails housing more inmates than their rated capacity decreased from 16% to 11%.
At midyear 2024, 20% of midsized jails with ADPs of 250–499 inmates were operating above their rated capacity, compared with 3% of the largest jails with ADPs of 2,500 or more inmates and 5% of the smallest jails with ADPs of fewer than 50 inmates (display 20).
Local jails employed 214,100 staff in 2024, nearly 10% below the peak in 2019 (237,500) (display 21). Of these, 164,800 were correctional officers and 49,400 were other jail staff, including administrators, clerical and maintenance staff, educational staff, professional and technical staff, and other unspecified staff. Throughout the period from 2015 to 2024, more than 75% of jail staff members were correctional officers, and nearly 70% of correctional officers were male.
At midyear 2024, there were 4.0 inmates for every correctional officer in local jails, similar to the previous two years but below the ratio observed in 2014 (4.2) (display 22).
Persons supervised outside jail and those serving weekend sentences
In addition to supervising inmates in custody, local jails operate various programs such as electronic monitoring, home detention, day reporting, community service, alcohol or drug treatment programs, and other pretrial supervision and work programs outside of a jail facility. At midyear 2024, local jails supervised 43,600 persons in such programs outside of jail, a 13% decline from midyear 2023 (50,100) (display 23).
An estimated 4,300 persons served weekend-only sentences at midyear 2024, a 26% increase from 3,400 in 2023 but a 56% decrease from the 9,700 recorded in 2014 (display 24).
Download data tables
This zip archive contains tables in individual .csv spreadsheets from Jail Inmates in 2024 – Statistical Tables.
| All data tables | Data tables (Zip format 28K) |
| Table 1. Persons held in jail at midyear, average daily population, annual admissions, and jail incarceration rates, 2014–2024 | Download csv (4K) |
| Table 2. Persons held in jail at midyear, average daily population, annual admissions, and jail incarceration rates, by state, 2024 | Download csv (5K) |
| Table 3. Persons held in local jails, by sex, 2014–2024 | Download csv (3K) |
| Table 4. Adults held in local jails, by age group, 2020–2024 | Download csv (3K) |
| Table 5. Juveniles held in local jails, by sex, 2014–2024 | Download csv (2K) |
| Table 6. Persons held in local jails, by race and ethnicity, 2014–2024 | Download csv (4K) |
| Table 7. Persons held in local jails, by sex and race/ethnicity, 2024 | Download csv (2K) |
| Table 8. Jail incarceration rates per 100,000 U.S. residents, by sex, 2014–2024 | Download csv (3K) |
| Table 9. Adult jail incarceration rates per 100,000 U.S. residents, by age group, 2020–2024 | Download csv (3K) |
| Table 10. Jail incarceration rates per 100,000 U.S. residents, by race and ethnicity, 2014–2024 | Download csv (4K) |
| Table 11. Persons held in local jails, by conviction status, 2014–2024 | Download csv (3K) |
| Table 12. Persons held in local jails, by offense severity, 2015–2024 | Download csv (4K) |
| Table 13. Persons held in local jails with probation or parole violations, 2019–2024 | Download csv (3K) |
| Table 14. Persons held in local jails for federal, state, and tribal correctional authorities, 2014–2024 | Download csv (5K) |
| Table 15. Average daily population in local jails, by sex, 2015–2024 | Download csv (3K) |
| Table 16. Annual admissions to local jails, by sex, 2015–2024 | Download csv (3K) |
| Table 17. Estimated average number of days in jail, by inmate sex, 2015–2024 | Download csv (3K) |
| Table 18. Estimated average number of days in jail, by size of jurisdiction and inmate sex, 2024 | Download csv (2K) |
| Table 19. Jail capacity and percent of capacity occupied, 2014–2024 | Download csv (5K) |
| Table 20. Jail capacity and percent of capacity occupied, by size of jurisdiction, 2024 | Download csv (4K) |
| Table 21. Staff employed in local jails, by job function and sex, 2015–2024 | Download csv (4K) |
| Table 22. Inmate-to-officer ratio in local jails, 2014–2024 | Download csv (3K) |
| Table 23. Persons supervised outside jail, 2014–2024 | Download csv (2K) |
| Table 24. Persons serving weekend-only sentences in jail, 2014–2024 | Download csv (2K) |
Terms and definitions
Admissions
All persons booked into and housed in jail facilities by formal legal document and the authority of the courts or some other official agency, including repeat offenders booked on new charges and persons sentenced to weekend programs or entering the facility for the first time. Excluded are inmates reentering the facility after an escape, work release, a medical appointment, a stay in a treatment facility, and a bail or court appearance.
Average daily population (ADP)
The sum of all inmates in jail each day for 1 year, divided by the number of days in the year.
Average time in jail
The average time in jail is estimated by dividing the ADP by the number of annual admissions, then multiplying the product by the number of days in a year.
Confined population
The number of inmates in the physical custody of local jails, regardless of conviction status or which authority has jurisdiction over the inmate.
Jail
A confinement facility generally operated under the authority of a sheriff, police chief, or county or city administrator. Jails house individuals before and after arraignment, usually for a period exceeding 72 hours, and those sentenced to incarceration of 1 year or less.
Jail incarceration rate
The number of inmates held in the custody of local jails per 100,000 U.S. residents.
Jail jurisdiction
A county (parish in Louisiana) or municipal government that administers one or more local jails and represents the entity responsible for managing jail facilities under its authority. Most jail jurisdictions consist of a single facility, but some have multiple facilities or multiple facility operators (e.g., a jail jurisdiction consisting of a county jail and a private jail operated under county authority).
Midyear population
The number of inmates held in custody on the last weekday in June.
Percent of capacity occupied at midyear
The midyear population divided by the rated capacity.
Persons under jail supervision but not confined
All persons in community-based programs operated by jail facilities, including electronic monitoring, house arrest, community service, day reporting, and work programs. This group excludes persons on pretrial release who are not in community-based programs run by jails; persons under supervision of probation, parole, or other agencies; persons on weekend programs; and persons who participate in work release programs and return to jail at night.
Rated capacity
Set by a rating official, rated capacity is the maximum number of beds or inmates that a facility can hold, excluding separate temporary holding areas.
Yearend population
The number of inmates held in custody on December 31. The yearend population is typically smaller than the midyear population.
Methodology
Data sources
Findings in this report are based on the 2019 and 2024 Census of Jails (COJ) and the 2014–2018 and 2020–2023 Annual Survey of Jails (ASJ). The Bureau of Justice Statistics (BJS) conducts the COJ, a complete enumeration of local jail facilities and Federal Bureau of Prisons (FBOP) detention facilities, to collect data on the inmate population and jail programs. The 2024 COJ was the 12th collection in the series since 1970. Beginning in 2024, the COJ is conducted annually. RTI International currently serves as the data collection agent.
Prior to 2024, BJS conducted the COJ periodically and administered the ASJ in the years when the COJ was not conducted. From 1982 to 2023, the ASJ sampled approximately one-third of the nation’s jails to provide national estimates of the number and characteristics of the jail inmate population. Both the COJ and ASJ are administered primarily through web-based surveys. In 2024, 96% of the COJ respondents completed the web-based survey, while the remaining respondents submitted data by email, fax, or phone. The ASJ was last conducted in 2023 and was discontinued when the COJ moved to an annual data collection schedule.
Local jails covered by the Census of Jails and Annual Survey of Jails
Jails are confinement facilities generally operated under the authority of a sheriff, police chief, or county or city administrator; a small number are privately operated. Regional jails include two or more jail jurisdictions with a formal agreement to operate a jail facility.
Jails house individuals before and after arraignment, usually for a period exceeding 72 hours, and those sentenced to incarceration of 1 year or less. Separate temporary holding facilities (such as drunk tanks and police lockups) that do not hold persons after they have been formally charged in court are not considered jails for the purpose of COJ and ASJ collections. Jail facilities include detention centers, county or city correctional centers, and special jail facilities (such as reception centers, medical or treatment centers, and prerelease centers). Jails are intended for adults but can hold juveniles before or after their cases are adjudicated.
Jails serve a variety of functions, including—
- holding inmates who are sentenced to jail facilities and usually have a sentence of 1 year or less;
- receiving individuals pending arraignment and holding them as they await trial, conviction, or sentencing;
- readmitting probation, parole, and bail bond violators and absconders;
- detaining juveniles pending their transfer to juvenile authorities;
- holding mentally ill persons pending their movement to appropriate mental health facilities;
- holding individuals for the military, for protective custody, as witnesses for courts, and for contempt of court;
- releasing convicted inmates to the community upon completion of sentence;
- transferring inmates to federal, state, or other authorities;
- housing inmates for federal, state, or other authorities due to crowding of their facilities; and
- operating community-based programs as alternatives to incarceration.
The COJ and ASJ cover all local jail jurisdictions (including county, city, regional, and privately operated jail facilities) in 44 states and the District of Columbia. Combined jail and prison systems in Alaska, Connecticut, Delaware, Hawaii, Rhode Island, Vermont, and West Virginia are excluded. These combined systems are operated by state departments of corrections and are included in BJS’s National Prisoner Statistics program. However, 14 independently operated jails in Alaska are in scope for the COJ and ASJ.
FBOP detention facilities that function as jails are included in the COJ data collection but excluded from the ASJ. FBOP facilities are excluded from findings in this report.
Sampling design of the Annual Survey of Jails
The ASJ used a stratified probability sampling design based on jail population data from the most recent COJ. The sample was drawn at the jail jurisdiction level. A jail jurisdiction is a legal entity that has responsibility for managing jail facilities. Jail jurisdictions typically operate at the county or municipal level, with a sheriff’s office or jail administrator overseeing the local facilities. Most jail jurisdictions consist of a single jail operator, but some have multiple operators (called reporting units), such as a sheriff’s office, a detention center, a correctional institution, or a privately operated jail. When a jail jurisdiction with multiple jail operators was sampled for the ASJ, data were collected from all reporting units within that jail jurisdiction.
The ASJ sample was refreshed every 5–6 years. Jails in the ASJ sample were surveyed annually until the next sample was drawn. The last sample refresh occurred in 2020, when a sample of 899 jail jurisdictions was selected to represent the 2,848 jail jurisdictions nationwide. In selecting jails, all jail jurisdictions were grouped into 10 strata based on their inmate population and the presence of juveniles on June 28, 2019. In 8 of the 10 strata, a random sample of jail jurisdictions was selected. The remaining two strata were designated as certainty strata and all jail jurisdictions within those strata were selected. One certainty stratum consisted of all jails that were operated jointly by two or more jurisdictions. The other certainty stratum consisted of large jail jurisdictions that on June 28, 2019, held either 750 or more adult inmates, or at least one juvenile inmate and a total of 500 or more inmates (see Jail Inmates, 2023 – Statistical Tables for the sample table of the 2023 ASJ data).
Response rates and nonresponse adjustment
Because the COJ is a complete enumeration of local jails, its estimates are not subject to sampling error. However, the estimates are affected by unit and item nonresponse, and adjustments are applied accordingly. The 2024 COJ covered 2,765 active jail reporting units nationwide as of midyear 2024, of which 2,597 (94%) responded. To reduce potential bias, BJS applied nonresponse weighting. The weight for jails in each state was calculated as the ratio of the state’s total inmate population to the inmate population in responding jail jurisdictions:
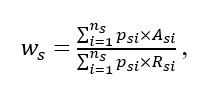
where—
ns = number of jail jurisdictions in state s,
psi = confined population at midyear 2024 for jail jurisdiction i in state s,
Asi = active status indicator for jail jurisdiction i in state s (1 = active, 0 = out of scope), and
Rsi = response indicator of jail jurisdiction i in state s (1 = respondent, 0 = non-respondent).
For nonresponding jail jurisdictions, inmate populations were unknown and were estimated using the imputation methods described below for the purpose of calculating nonresponse weights. A jail jurisdiction with multiple reporting units may have mixed response status if some reporting units respond and others do not. In such cases, the jail jurisdiction is treated as a respondent, and data for the nonresponding units are imputed (see Jail Inmates, 2023 – Statistical Tables for the nonresponse adjustment of ASJ data.)
Item nonresponse and imputation
Item response rates for the COJ and ASJ ranged from 91% to 100%. For responding jail jurisdictions that were unable to provide requested items, missing data were imputed (except for weekender programs, where offenders serve their sentences of confinement only on weekends). This imputation was done in two steps:
- A last observation carried forward (LOCF) procedure was used to replace the missing values with recent data from the same jails.
- For cases with no available recent data from the same jails, a weighted sequential hot deck (WSHD) procedure was implemented to impute the remaining missing data by borrowing values reported by similar jails in the current year.
Using the LOCF procedure as the first step of imputation increases imputation accuracy because jail population counts and characteristics typically remain relatively stable from year to year. This is especially helpful when imputing missing data for the largest jails that have no comparable-size donor jails. In the LOCF procedure, donor data consisted of reported data from the same jails in the 2020–2023 ASJ and the 2019 COJ, adjusted for average year-to-year changes. The adjustment factor was calculated as the ratio of the average of current-year to prior-year values in each weighting class. Only data from jails that provided data in both years were included in the calculation. By applying the average year-to-year adjustment factor, it was assumed that jails with missing items experienced the average year-to-year percentage change as other jails in the same weighting class. Missing data for inmate subpopulations (e.g., female adults) were imputed based on prior-year population distribution and current-year reported or imputed inmate population for the same jails.
In the second step, the donor for each missing item in the WSHD procedure was randomly selected from a set of similar jails, sorted by related auxiliary population values. Donor pools, also referred to as imputation classes, were formed by sampling stratum and jail size. Within each imputation class, jails were sorted by a variable related to the imputed items (e.g., jails were sorted by the percentage of the confined population that was male when imputing male and female average daily population (ADP)).
Data adjustments and revisions
To ensure data integrity, BJS conducted follow-up and applied data-processing procedures for the ASJ and COJ collections. While respondent callbacks resolved most missing items and discrepancies, remaining issues were addressed through statistical adjustments. For a small number of cases, subpopulation counts were adjusted to sum correctly to reported totals to maintain internal consistency. In addition, data fields containing extreme outliers or manifest reporting errors were masked and replaced through imputation. These adjustments were applied sparingly, affecting only a minimal number of records.
A targeted review of historical ASJ and COJ data also identified instances where "0" counts were recorded inaccurately. These values were reclassified as missing and, along with other incomplete fields, were addressed through imputation. Consequently, certain estimates for 2014–2016 in this report differ from those in previously published BJS reports.
Standard errors and significance testing
Standard errors for ASJ data were estimated in Stata using Taylor Series Linearization. COJ data are based on complete enumerations of jails in the United States, so standard errors are not calculated for census years.
BJS conducted statistical tests to determine whether observed changes over time were significant once sampling error was accounted for. All comparisons cited in this report were tested at the 95% confidence level using the Student’s t-test.
Reference dates and seasonal variations in jail populations
Prior to 2015, the ASJ asked jails to report total and detailed inmate counts on the last weekday in June (the midyear reference date). In 2015 and 2016, the ASJ collected the total confined population at midyear, but detailed inmate counts by demographic and criminal justice characteristic (e.g., sex, race/ethnicity, conviction status, and offense severity) on December 31 (the yearend reference date). Starting with the 2017 collection, the ASJ reverted to the midyear reference.
Comparisons of yearend data with midyear data need to consider seasonal variations, as jails typically hold fewer inmates at yearend than at midyear. For example, in 2015 and 2016, the yearend population was 5% less than the midyear population. To adjust for seasonal variation, yearend inmate counts by demographic and criminal justice characteristics in 2015 and 2016 were multiplied by the ratio of the midyear total population to the yearend total population of the corresponding year. The standard errors for the 2015 and 2016 counts were similarly adjusted. Seasonal adjustment was also applied in calculating the 2015 and 2016 jail incarceration rates by demographic characteristics and their standard errors.
The reference periods for annual admissions, ADP, and average time in jail are the 12 months from July 1 of the previous year to June 30 of the current year. However, in 2015 and 2016, the reference periods are based on the calendar year. BJS started collecting 12-month admissions in 2015. Before 2015, admissions were reported for the last 7 days of June.
Jail incarceration rates
BJS receives advanced estimates from the U.S. Census Bureau of national resident populations by age, sex, and race or Hispanic origin. These estimates are based on proprietary calculations using the most recent decennial survey and the American Community Survey results. BJS uses these estimates to calculate jail incarceration rates. Rates for 2023 and earlier may have been revised from previous reports due to revisions in population estimates for U.S. residents or the correctional population.
How to cite this report
Bureau of Justice Statistics, "Jail Inmates in 2024 - Statistical Tables," September 2026:
https://bjs.ojp.gov/library/publications/jail-inmates-2024-statistical-tables/web-report
The Bureau of Justice Statistics of the U.S. Department of Justice is the principal federal agency responsible for measuring crime, criminal victimization, criminal offenders, victims of crime, correlates of crime, and the operation of criminal and civil justice systems at the federal, state, tribal, and local levels. BJS collects, analyzes, and disseminates reliable statistics on crime and justice systems in the United States, supports improvements to state and local criminal justice information systems, and participates with national and international organizations to develop and recommend national standards for justice statistics. Kevin M. Scott, PhD, is the acting director.
This report was written by Zhen Zeng, PhD. Michael Field verified the report.
Jonathan Fusfield edited the report. Vesela Kostadinova produced this report.
September 2026, NCJ 311504