Zhen Zeng, PhD; E. Ann Carson, PhD; and
Rich Kluckow, DSW, BJS Statisticians
Download PDF (756K)
JUNE 2023, NCJ 306140
Juveniles (persons age 17 or younger) arrested or convicted for a criminal offense may be housed in juvenile residential facilities or in adult jails and prisons, depending on state statute, judicial discretion, and federal law. This report details trends for juveniles who are held in adult facilities.
Key Findings
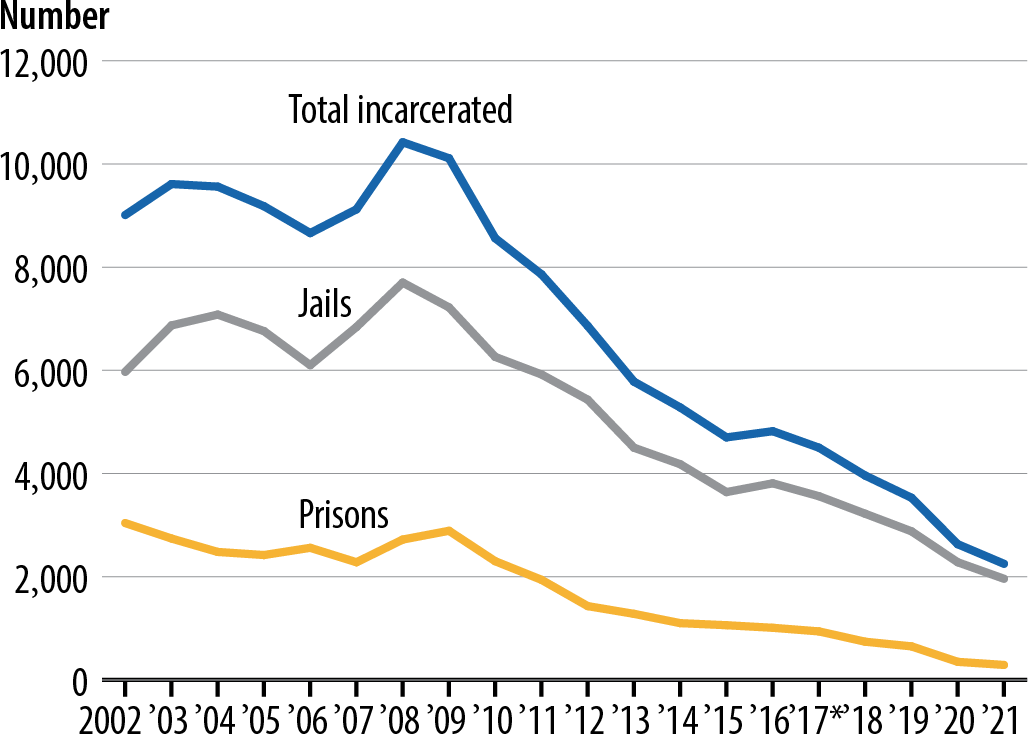
- The number of juveniles incarcerated in all U.S. adult prisons or jails declined from a peak of 10,420 in 2008 to a low of 2,250 in 2021 (figure 1).
- In 2021, local jails had custody of 1,960 juveniles while state and federal adult prisons held 290.
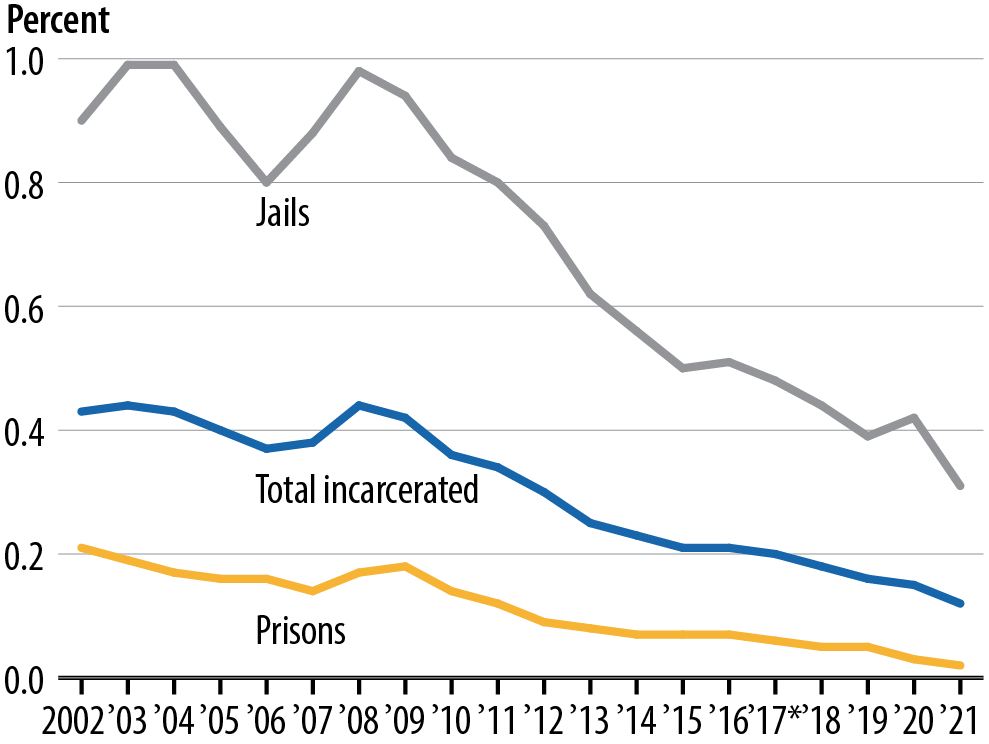
- The percent of the total jail population who were juveniles declined from 0.9% in 2002 to 0.3% in 2021 (figure 2).
- The percent of the total prison population who were juveniles declined from 0.2% in 2002 to 0.02% in 2021.
- In 2021, 87% of juveniles in adult correctional facilities were held in local jails and 13% were held in prisons, compared to 66% in local jails and 34% in prisons in 2002, the earliest year for which comparable data are available for both populations (table 1).
Figure 1. Reported number of juveniles held in the custody of adult jails or prisons, 2002–2021
*Prior to 2017, state departments of corrections reported juveniles in their publicly operated facilities only; privately operated facilities were included in state data starting in 2017. The Federal Bureau of Prisons did not report juvenile counts in custody in 2002–2004, 2007, 2008, and 2010. See more details in Measures of Incarcerated Juveniles.
Source: Bureau of Justice Statistics, National Prisoner Statistics program, 2002–2021; Annual Survey of Jails, 2002–2004, 2006–2018, and 2020–2021; and Census of Jails, 2005 and 2019.
Figure 2. Juveniles as a percent of the incarcerated populations of adult jails and prisons, 2002–2021
*Prior to 2017, state departments of corrections reported juveniles in their publicly operated facilities only; privately operated facilities were included in state data starting in 2017. The Federal Bureau of Prisons did not report juvenile counts in custody in 2002–2004, 2007, 2008, and 2010. See more details in Measures of Incarcerated Juveniles.
Source: Bureau of Justice Statistics, National Prisoner Statistics program, 2002–2021; Annual Survey of Jails, 2002–2004, 2006–2018, and 2020–2021; and Census of Jails, 2005 and 2019.
|
|
| |||||||||
|---|---|---|---|---|---|---|---|---|---|---|---|
|
|
| Jail total |
|
| Prison total |
|
|
|
| |
2002 | 9,010 | 8,470 | 540 | 5,970 | 5,540 | 430 | 3,040 | / | 3,040 | 2,930 | 110 |
| 2003 | 9,610 | 8,980 | 630 | 6,870 | 6,350 | 520 | 2,740 | / | 2,740 | 2,630 | 110 |
2004 | 9,560 | 8,870 | 690 | 7,080 | 6,500 | 580 | 2,480 | / | 2,480 | 2,370 | 110 |
2005 | 9,180 | 8,480 | 700 | 6,760 | 6,150 | 610 | 2,420 | 210 | 2,210 | 2,330 | 90 |
2006 | 8,660 | 8,100 | 560 | 6,100 | 5,650 | 450 | 2,560 | 190 | 2,360 | 2,450 | 110 |
2007 | 9,120 | 8,500 | 620 | 6,840 | 6,310 | 530 | 2,280 | / | 2,280 | 2,190 | 90 |
2008 | 10,420 | 9,840 | 590 | 7,700 | 7,210 | 500 | 2,720 | / | 2,720 | 2,630 | 90 |
2009 | 10,110 | 9,480 | 630 | 7,220 | 6,690 | 530 | 2,890 | 140 | 2,740 | 2,790 | 100 |
2010 | 8,560 | 7,990 | 560 | 6,260 | 5,770 | 480 | 2,300 | / | 2,300 | 2,220 | 80 |
2011 | 7,860 | 7,340 | 520 | 5,920 | 5,470 | 450 | 1,940 | 150 | 1,790 | 1,870 | 70 |
2012 | 6,860 | 6,360 | 500 | 5,430 | 4,980 | 450 | 1,430 | 110 | 1,330 | 1,380 | 50 |
2013 | 5,780 | 5,370 | 400 | 4,500 | 4,140 | 350 | 1,280 | 90 | 1,190 | 1,230 | 50 |
2014 | 5,280 | 4,920 | 370 | 4,180 | 3,850 | 340 | 1,100 | 70 | 1,040 | 1,070 | 30 |
2015c | 4,700 | 4,330 | 360 | 3,640 | 3,310 | 330 | 1,060 | 60 | 990 | 1,020 | 30 |
2016c | 4,820 | 4,390 | 420 | 3,810 | 3,420 | 390 | 1,010 | 50 | 960 | 970 | 30 |
2017 | 4,500 | 4,180 | 310 | 3,560 | 3,290 | 270 | 940 | 40 | 890 | 890 | 40 |
2018 | 3,960 | 3,610 | 350 | 3,220 | 2,900 | 320 | 740 | 40 | 700 | 710 | 30 |
2019 | 3,530 | 3,290 | 250 | 2,880 | 2,660 | 230 | 650 | 30 | 630 | 630 | 20 |
2020 | 2,630 | 2,480 | 150 | 2,280 | 2,140 | 140 | 350 | 10 | 340 | 340 | 10 |
2021 | 2,250 | 2,080 | 160 | 1,960 | 1,800 | 150 | 290 | 20 | 270 | 280 | 10 |
Note: Includes persons age 17 or younger. All data are adjusted for nonresponse and rounded to the nearest 10. Details may not sum to totals due to rounding. Results may differ from previous reports due to updates from jail and prison respondents. | |||||||||||
Measures of Incarcerated Juveniles
Data for this report come from local jail authorities, prisons through state departments of corrections (DOCs), and the Federal Bureau of Prisons (BOP). Local jail data are based on the jail inmate population confined on the last weekday in June, unless otherwise specified. Prison data are based on persons in the custody of state or federal correctional facilities as of December 31. From 2000 to 2016, the Bureau of Justice Statistics (BJS) asked DOCs and the BOP to report the number of persons age 17 or younger in the custody of their publicly operated adult correctional facilities. Starting in 2017, BJS asked DOCs and the BOP to also include persons age 17 or younger housed in privately operated adult correctional facilities contracted to DOCs and the BOP. Historically, the BOP has only held persons age 17 or younger in adult contract facilities, and these counts were reported to BJS in 2005, 2006, 2009, and 2011 to 2021. BOP data were not submitted to BJS for 2002 to 2004, 2007, 2008, and 2010. More information can be found on the BJS website about the National Prisoner Statistics program, Annual Survey of Jails, and Census of Jails.
Jail total | Male | Female | |
2002 | 186 | 177 | 27 |
| 2003 | 379 | 342 | 57 |
2004 | 188 | 170 | 33 |
2005 | ~ | ~ | ~ |
2006 | 148 | 140 | 22 |
2007 | 166 | 145 | 36 |
2008 | 170 | 155 | 29 |
2009 | 195 | 175 | 37 |
2010 | 226 | 204 | 47 |
2011 | 175 | 158 | 36 |
2012 | 245 | 224 | 34 |
2013 | 207 | 184 | 47 |
2014 | 168 | 152 | 30 |
2015 | 121 | 107 | 30 |
2016 | 154 | 121 | 54 |
2017 | 128 | 120 | 20 |
2018 | 131 | 121 | 25 |
2019 | ~ | ~ | ~ |
2020 | 93 | 91 | 9 |
2021 | 69 | 65 | 17 |
~Not applicable. Data represent a complete enumeration based on the Census of Jails. | |||
Total incarcerated | Jails | Prisons | |||||||
|---|---|---|---|---|---|---|---|---|---|
Juveniles | Juveniles | Juvenilesa | |||||||
| Total population |
|
| Total | Number |
| Total population |
|
| |
2002 | 2,105,620 | 9,010 | 0.43% | 665,480 | 5,970 | 0.90% | 1,440,140 | 3,040 | 0.21% |
| 2003 | 2,159,900 | 9,610 | 0.44 | 691,300 | 6,870 | 0.99 | 1,468,600 | 2,740 | 0.19 |
2004 | 2,211,090 | 9,560 | 0.43 | 713,990 | 7,080 | 0.99 | 1,497,100 | 2,480 | 0.17 |
2005 | 2,286,710 | 9,180 | 0.40 | 760,800 | 6,760 | 0.89 | 1,525,910 | 2,420 | 0.16 |
2006 | 2,334,490 | 8,660 | 0.37 | 765,820 | 6,100 | 0.80 | 1,568,670 | 2,560 | 0.16 |
2007 | 2,377,420 | 9,120 | 0.38 | 780,580 | 6,840 | 0.88 | 1,596,840 | 2,280 | 0.14 |
2008 | 2,393,810 | 10,420 | 0.44 | 785,530 | 7,700 | 0.98 | 1,608,280 | 2,720 | 0.17 |
2009 | 2,382,920 | 10,110 | 0.42 | 767,430 | 7,220 | 0.94 | 1,615,490 | 2,890 | 0.18 |
2010 | 2,362,530 | 8,560 | 0.36 | 748,730 | 6,260 | 0.84 | 1,613,800 | 2,300 | 0.14 |
2011 | 2,334,570 | 7,860 | 0.34 | 735,600 | 5,920 | 0.80 | 1,598,970 | 1,940 | 0.12 |
2012 | 2,314,920 | 6,860 | 0.30 | 744,520 | 5,430 | 0.73 | 1,570,400 | 1,430 | 0.09 |
2013 | 2,308,160 | 5,780 | 0.25 | 731,210 | 4,500 | 0.62 | 1,576,950 | 1,280 | 0.08 |
2014 | 2,306,910 | 5,280 | 0.23 | 744,590 | 4,180 | 0.56 | 1,562,320 | 1,100 | 0.07 |
2015b | 2,254,010 | 4,700 | 0.21 | 727,410 | 3,640 | 0.50 | 1,526,600 | 1,060 | 0.07 |
2016b | 2,248,800 | 4,820 | 0.21 | 740,670 | 3,810 | 0.51 | 1,508,130 | 1,010 | 0.07 |
2017 | 2,234,350 | 4,500 | 0.20 | 745,160 | 3,560 | 0.48 | 1,489,190 | 940 | 0.06 |
2018 | 2,202,830 | 3,960 | 0.18 | 738,440 | 3,220 | 0.44 | 1,464,390 | 740 | 0.05 |
2019 | 2,164,640 | 3,530 | 0.16 | 734,470 | 2,880 | 0.39 | 1,430,170 | 650 | 0.05 |
2020 | 1,770,300 | 2,630 | 0.15 | 549,140 | 2,280 | 0.42 | 1,221,160 | 350 | 0.03 |
2021 | 1,840,660 | 2,250 | 0.12 | 636,340 | 1,960 | 0.31 | 1,204,320 | 290 | 0.02 |
Note: Data are adjusted for nonresponse and rounded to the nearest 10. Details may not sum to totals due to rounding. Results may differ from previous reports due to updates from jail and prison respondents. | |||||||||
The Bureau of Justice Statistics of the U.S. Department of Justice is the principal federal agency responsible for measuring crime, criminal victimization, criminal offenders, victims of crime, correlates of crime, and the operation of criminal and civil justice systems at the federal, state, tribal, and local levels. BJS collects, analyzes, and disseminates reliable statistics on crime and justice systems in the United States, supports improvements to state and local criminal justice information systems, and participates with national and international organizations to develop and recommend national standards for justice statistics. Alexis R. Piquero, PhD, is the director.
This report was written by Zhen Zeng, PhD; E. Ann Carson, PhD; and Rich Kluckow, DSW. Danielle Kaeble verified the report.
Brigit Baron and Maureen Stuart edited the report. Tina Dorsey produced the PDF.
Priscilla Fauntleroy produced the web version of this report.
June 2023, NCJ 306140


