SPI DAT User's Guide
1. ABOUT THE SPI DAT
The Survey of Prison Inmates Data Analysis Tool (SPI DAT) enables users to examine select characteristics of prisoners from the most recent Survey of Prison Inmates (SPI, 2016). The SPI is a cross-sectional survey of the state and sentenced federal prison populations that is conducted by the Bureau of Justice Statistics (BJS) periodically. Its primary objective is to produce national statistics on these populations across a variety of topics. Data from the 2016 SPI were collected through face-to-face interviews with a nationally representative sample of 24,848 state and federal prisoners from January through October 2016. The sample estimates were weighted to represent the total state and sentenced federal prison populations at yearend 2015. (Click here for more information on the 2016 SPI.)
This tool features data on prisoners from the 2016 SPI on the following topics:
- Demographic characteristics
- Offense type
- Firearm possession
- Criminal history
- Socioeconomic characteristics
- Family background
- Physical and mental health
- Substance use
- Other select topics.
The SPI DAT includes Key Charts that display key characteristics of prisoners and Custom Charts that allow users to choose from the variables and presentation options available to create their own charts (or tables).
2. STATISTICS AND INTERPRETING RESULTS
All statistics in this tool reflect weighted estimates. The primary statistic displayed in this tool is a percentage, but additional statistics are available in the tooltip by hovering the cursor over the individual bars of a chart (or percentages in a table). Users can also obtain the standard error and count of a percentage. Percentages in this tool are rounded to one decimal place and standard errors are rounded to two decimal places. The rounding of SPI DAT estimates can result in slightly different estimates (e.g., by one decimal place) than some SPI estimates previously published in BJS reports. Users should also be aware that the use of different statistical software packages can also result in slightly different estimates than those that appear in the SPI DAT.
Note that the SPI DAT does not reflect tests of statistical significance; differences that appear statistically significant may not be. Therefore, users should not draw inferences when making comparisons. The standard error of a percentage is included in the tool to provide a measure of error. See section 8 (ACCURACY OF ESTIMATES) for more information.
All variables in this tool have an item nonresponse rate of less than 5%, with the exception of four variables: total time expected to serve (missing for 10.7% of state prisoners and 7.6% of federal prisoners), time left to expected release (missing for 7.7% of state prisoners), number of times ever arrested (missing for 6.1% of federal prisoners), and sources/methods used to obtain firearm (missing for 10.3% of state prisoners and 14.1% of federal prisoners). All statistics in this tool exclude missing data.
3. KEY CHARTS
The Home Page contains a dashboard of 10 Key Charts covering key characteristics of interest. Options to download the results and view footnotes are provided in the menu icon at the top right corner of a chart.
4. CUSTOM CHARTS
Creating custom charts
Custom Charts allows users to create custom charts (or tables) based on select characteristics of interest. This option also allows users to further analyze these characteristics by demographic and offense characteristics of prisoners.
Users must first select an option for each of the three standard filters: Population, Topic, and Variable of interest. Then users must select the “View custom charts” button to view the results.
- When the Population, Topic, or Variable filters are altered, the tool will autopopulate with the new selection(s) and associated estimates.
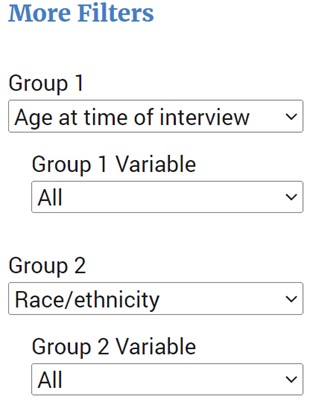
- To select additional filters, use the Group 1 and Group 2 options on the right side of the Custom Charts view under More Filters. The default characteristic for Group 1 is Age at time of interview (“All” categories), and the default characteristic for Group 2 is Race/ethnicity (“All” categories).
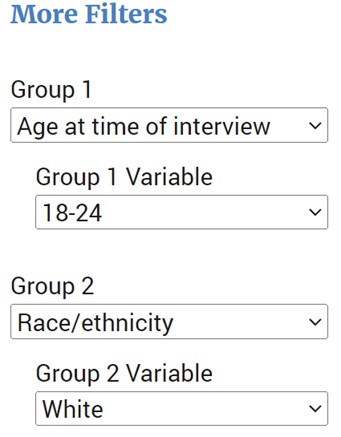
- To select a specific category of a characteristic selected in the Group 1 or Group 2 filters, use the Group 1 Variable and Group 2 Variable filters, and the tool will autopopulate with those specific results.
- Use the “Clear Filters” button to reset the Group 1 Variable and Group 2 Variable filters to the default of “All.” (Note: The “Clear Filters” button will not reset the Group 1 or Group 2 level filters, or the Population, Topic, or Variable filters).
Custom chart results
The first chart presented in the Custom Charts view displays results for the selections of the three standard filters: Population, Topic, and Variable.
- In the example below, the Population selected is State prisoners, the Topic selected is Socioeconomic characteristics, and the Variable selected is Parent of a minor child. The chart shows that 46.9% of state prisoners in 2016 were a parent of a minor child while 53.1% were not a parent of a minor child.
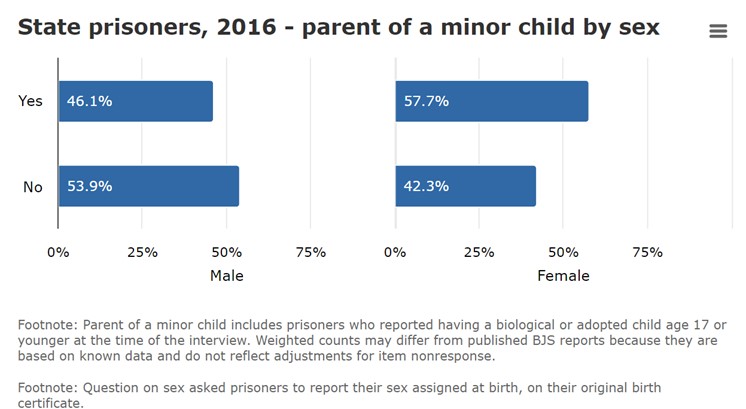
The second chart in the Custom Charts view displays results for the Population, Topic, and Variable selected by the Group 1 filter selected under More Filters.
- In the example below, the Population selected is State prisoners, the Topic selected is Socioeconomic characteristics, and the Variable selected is Parent of a minor child. The chart displays the results for those three standard filters by the Group 1 filter, which is Sex. The categories for the Group 1 filter appear at the bottom of the chart. The chart shows that among male state prisoners in 2016, 46.1% were a parent of a minor child while 53.9% were not a parent of a minor child. Among female state prisoners in 2016, 57.7% were a parent of a minor child while 42.3% were not.
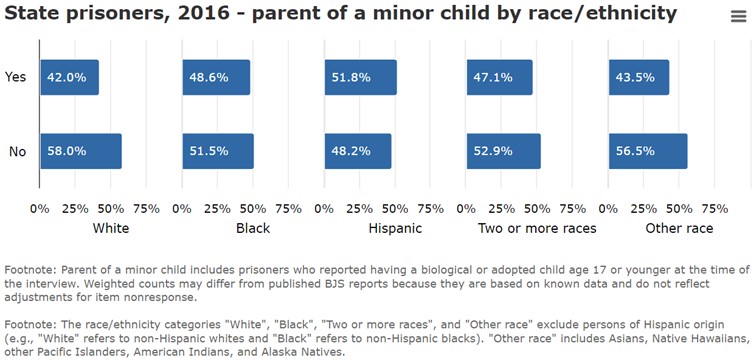
The third chart displays results for the Population, Topic, and Variable selected by the Group 2 filter selected under More Filters.
- In the example below, the Population selected is State prisoners, the Topic selected is Socioeconomic characteristics, and the Variable selected is Parent of a minor child. The chart displays the results for those three standard filters by the Group 2 filter, which is Race/ethnicity. The categories for the Group 2 filter appear at the bottom of the chart. The chart shows that among white state prisoners in 2016, 42.0% were a parent of a minor child while 58.0% were not a parent of a minor child. Another example of a result from the chart is that 48.6% of Black state prisoners in 2016 were a parent of a minor child while 51.5% were not.
The last set of results presented in the Custom Charts view is a table that displays results for the Population, Topic, and Variable selected by the Group 1 and Group 2 filters selected under More Filters.
- In the example below, the Population selected is State prisoners, the Topic selected is Socioeconomic characteristics, and the Variable selected is Parent of a minor child. The table displays the results for those three standard filters by the Group 1 filter, which is Sex, and the Group 2 variable, which is Race/ethnicity. The categories for the Group 1 filter (Sex) appear on the left side of the table to identify the rows, and the categories for the Group 2 filter (Race/ethnicity) appear at the top of the table to identify the columns. The chart shows that 39.8% of white males in state prison were a parent of a minor child in 2016. Another example of a result from the chart is that 49.9% of Black females in state prison were not a parent of a minor child in 2016.
If the Group 1 Variable or Group 2 Variable filters are set to a specific category rather than “All,” fewer charts will be displayed and the table will be suppressed.
- For example, if the Group 1 Variable filter is set to a specific category (e.g., “Male”) and the Group 2 Variable filter is set to “All,” only two charts will be displayed.
- The first chart will display results for the Population, Topic, and Variable selected but only for the category selected (e.g., “Male”) in the Group 1 Variable filter.
- The second chart will display results for the Population, Topic, and Variable selected for the category selected (e.g., “Male”) in the Group 1 filter by “All” categories of the Group 2 filter selected.
- The tool will display two similar charts if the Group 1 Variable is set to “All” and the Group 2 Variable is set to a specific category.
- If both the Group 1 Variable and Group 2 Variable filters are set to a specific category, rather than “All,” only one chart is necessary to display the specific results.
- The chart will display results for the Population, Topic, and Variable selected for the categories selected in the Group 1 Variable (e.g., “Male”) and Group 2 Variable (e.g., “White”) filters.
5. INTERACTING WITH SPI DAT CHARTS
When a filter of a chart (or a table) is altered, the tool will autopopulate with the new selection and associated estimates.
Users can view additional statistics for charts (or tables) in the tooltip by hovering the cursor over the bars of a chart (or percentages in a table). The tooltip will display the percentage, the standard error of the percentage, and the weighted count of the percentage.
Footnotes associated with specific filters selected in a chart (or a table) can be viewed and hidden by selecting the “Display/hide footnote” option in the menu icon at the top right corner of a chart. Footnotes associated with specific filters selected in a chart (or a table) will appear directly below the chart (or table).
A value of ~ in a chart (or a table) indicates that the estimate is based on fewer than 10 sample cases and cannot be displayed. A chart with all ~ values indicates the sample size is too small to generate reliable estimates with the combination of filters selected. This information appears as a footnote on the right side of the Custom Charts view below the “Clear Filters” button.
A value of – in a chart (or a table) indicates that the estimate is equal to 0 sample cases and cannot be displayed. This information appears as a footnote on the right side of the Custom Charts view below the “Clear Filters” button.
6. DOWNLOAD OPTIONS
Options to download results for Key Charts and Custom Charts are provided in the menu icon at the top right corner of a chart. To download a chart image, click on the menu icon and select “Download PDF document.” To download the estimates presented in the chart, select “Download CSV.”
To download chart footnotes, select the “Download CSV” option in the menu icon at the top right corner of a chart. If footnotes are toggled on using the “Display/hide footnotes” option in the menu icon of a chart, the footnotes can be downloaded in the “Download PDF document” option also, and they will appear at the bottom of the PDF document.
Results displayed as a table in the Custom Charts view cannot currently be downloaded.
7. TERMS AND DEFINITIONS
See Terms & Definitions for more information on the variables and terms included in the SPI DAT.
8. ACCURACY OF ESTIMATES
To produce estimates for the 2016 SPI, BJS selected a representative sample of state and sentenced federal prisoners from the total state and sentenced federal prison populations. With sample surveys, the estimates derived reflect information from the sample, which is then weighted to represent the population of interest. [For more information on the 2016 SPI methodology, see Methodology: Survey of Prison Inmates, 2016 (NCJ 252210, BJS, July 2019).] Because of this, sample estimates are subject to sampling error. In addition, when selecting the sample, it is possible to select different samples that are also nationally representative even when using the same design and selection procedures. The estimates derived from any one of these samples would differ from one another due to sampling variability or sampling error. Sampling error is often quantified with the standard error as described below.
In addition to sampling error, the estimates in this analysis tool are subject to nonsampling error. Sources of nonsampling error include nonresponse error, respondent recall error, measurement error, interviewer and mode effects on response, and data entry error. Although substantial care is taken in the SPI to reduce sources of nonsampling error throughout all survey operations by means of quality controls, operational controls, and error-correcting procedures, an unquantified amount of nonsampling error still remains. These nonsampling errors can be difficult to measure.
- Standard error
When national estimates are derived from a sample, as with the SPI, caution must be used when comparing one estimate to another or when comparing estimates between years. Although one estimate may be larger than another, estimates based on a sample rather than a complete enumeration of the population have some degree of sampling error. The sampling error of an estimate depends on several factors, including the size of the estimate, the number of completed interviews, and the intracluster correlation of the outcome within prisons. When the sampling error around an estimate is taken into account, estimates that appear different may not be statistically different.
One measure of the sampling error associated with an estimate is the standard error, which measures the variation between a sample estimate and the average of all possible estimates that could be obtained by taking different samples from the same population. The standard error may vary from one estimate to the next. Generally, an estimate with a smaller standard error provides a more reliable approximation of the true value than an estimate with a larger standard error. Estimates with relatively large standard errors have less precision and reliability and should be interpreted with caution.
For complex sample designs like the SPI, there are several methods that can be used to generate standard errors around a point estimate. In this tool, Taylor series linearization (TSL) was used to estimate the standard errors of percentages. The TSL method directly estimates variances through a linearized function by combining variance estimates from stratum and primary sampling units used to sample prisoners.
- Confidence intervals
While the SPI DAT does not include confidence intervals, users may use the estimates and standard errors of the estimates provided in this tool to generate a 95% confidence interval around the estimate as a measure of the margin of error. Typically, multiplying the standard error by ± 1.96 (the t-score of a normal, two-tailed distribution that excludes 2.5% at either end of the distribution) and then adding or subtracting the result from the estimate produces the confidence interval. This interval expresses the range of values with which the true population parameter is expected to fall 95% of the time if the same sampling method is used to select different samples.
For small samples and estimates close to 0%, the use of the standard error to construct a 95% confidence interval may not be reliable. Therefore, caution should be used when interpreting the estimates. Caution should also be used if constructing a 95% confidence interval, which would include zero in these cases, because the estimate may not be distinguishable from zero.
It should be noted though that the most accurate way to compute confidence intervals, especially for complex sample designs such as the 2016 SPI, is to account for the final SPI weight and all design parameters.
The SPI DAT does not reflect tests of statistical significance; differences that appear statistically significant may not be. Therefore, caution should be used and users should not draw inferences when comparing estimates. The standard error of a percentage is included in the SPI DAT to provide a measure of error.
Users should also be aware that because percentages in this tool are rounded to one decimal place and standard errors are rounded to two decimal places, estimates in the SPI DAT may be slightly different (e.g., by one decimal place) than some SPI estimates previously published in BJS reports. The use of different statistical software packages can also result in slightly different estimates than those that appear in the SPI DAT.
9. FOR QUESTIONS ABOUT THE SPI DAT
The tool is best viewed with Google Chrome, Microsoft Edge, or Mozilla Firefox. Though the tool has been optimized for viewing on computers and tablets, it can be used on a mobile device. A user’s screen resolution may affect the display of charts (or tables).
Please direct any questions about the SPI DAT to [email protected] and include “SPI DAT” in the subject line of the email.
Inquiries can also be directed to the BJS main number at (202) 307-0765 or by mail to—
Bureau of Justice Statistics
U.S. Department of Justice
999 North Capitol Street, NE
Washington, DC 20531
ATTN: SPI DAT
10. HOW TO CITE RESULTS FROM THE SPI DAT
When publishing results from BJS’s SPI DAT in any form, the recommended citation is—
Bureau of Justice Statistics. [Insert chart/table title]. Generated using the 2016 SPI Data Analysis Tool (SPI DAT) at spi-data.bjs.ojp.gov. Report generated [Insert date generated].
Please use the following information when citing the SPI DAT:
Bureau of Justice Statistics (BJS)
Tool title: 2016 SPI Data Analysis Tool (SPI DAT)
Data source: BJS, Survey of Prison Inmates (SPI), 2016
Data accessed (or generated): [Insert date here]


