Miles Wang, Former BJS Fellow, and
Alexandra Thompson, BJS Statistician
July 2025
NCJ 310166
Not all crimes are reported to police, and different factors can influence whether a crime is reported, such as the type of crime or location where the victim resides. In the National Crime Victimization Survey (NCVS), victims’ residences can be classified as urban, suburban, or rural (see Methodology). Aggregate data from the 2020–2023 NCVS indicate that the share of victimizations reported to police varies by location of residence for both violent and property crime.
Key Findings
In 2020–2023:
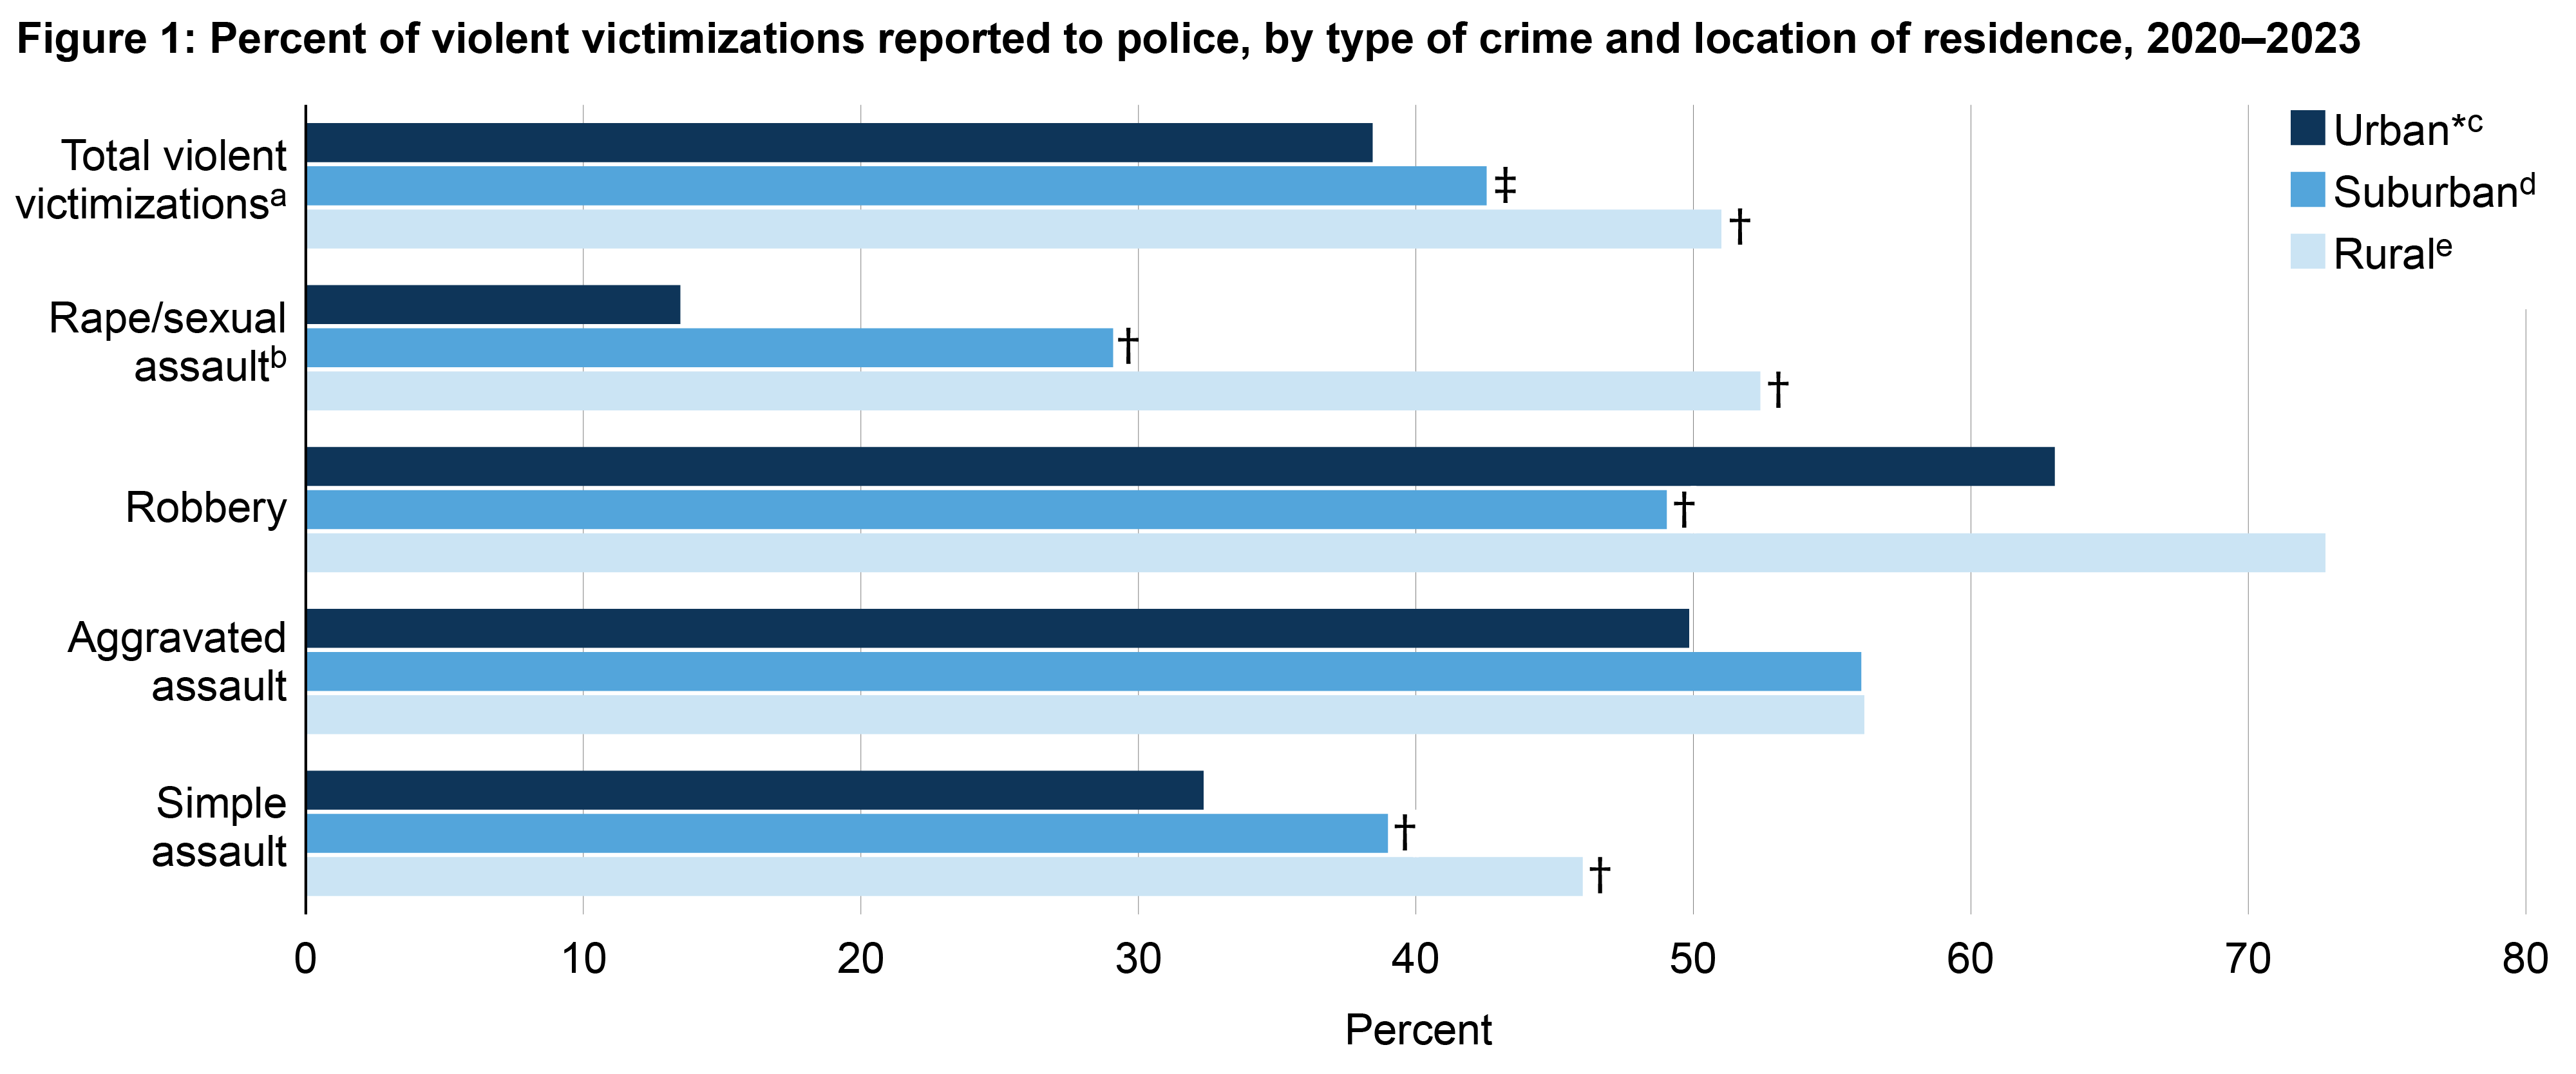
- About 38% of violent victimizations in urban areas were reported to police, which was lower than the percentages in suburban (43%) and rural (51%) areas (figure 1).
- The percentage of rape and sexual assault victimizations in rural areas that were reported to police (52%) was almost four times higher than the share reported to police in urban areas (13%), and almost two times higher than the share reported in suburban areas (29%).
- Reporting to police for simple assault victimizations was higher in suburban (39%) and rural areas (46%) than urban areas (32%).
- For robbery, the percentage of victimizations reported to police was lower in suburban areas (49%) than urban areas (63%). The percentage of robbery victimizations reported to police was not statistically different between urban and rural areas.
Note: See appendix table 1 for estimates and standard errors.
*Comparison group.
†Difference with comparison group is significant at the 95% confidence level.
‡Difference with comparison group is significant at the 90% confidence level.
aIncludes rape or sexual assault, robbery, aggravated assault, and simple assault. Excludes homicide because the National Crime Victimization Survey (NCVS) is based on interviews with victims.
bSee Methodology in Criminal Victimization, 2023 (NCJ 309335, BJS, September 2024) for details on the measurement of rape or sexual assault in the NCVS.
cAll census blocks within cities or U.S. Census Bureau-designated places that meet certain criteria based on their population and density. See Methodology in Criminal Victimization, 2019 (NCJ 255113, BJS, September 2020).
dAll other census blocks not classified as urban or rural.
eAll census blocks not in U.S. Census Bureau-defined urbanized areas or urban clusters.
Source: Bureau of Justice Statistics, National Crime Victimization Survey, 2020–2023.
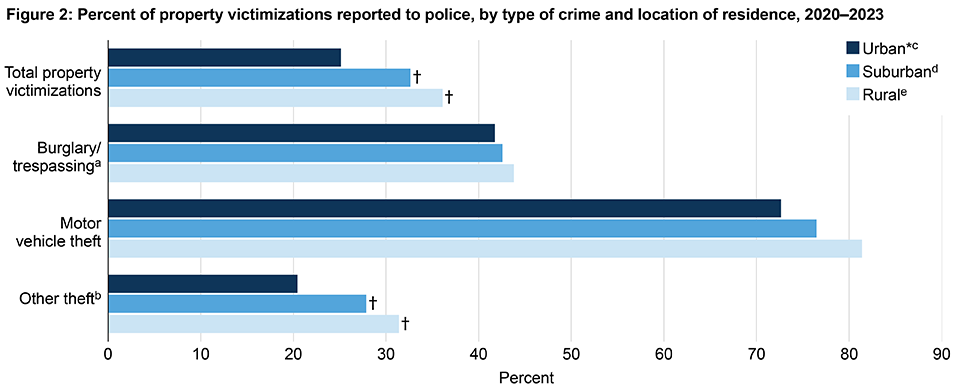
- Patterns in police reporting for property crime during 2020–2023 were similar to those for violent crime. A quarter (25%) of all property victimizations in urban areas were reported to police, which was lower than the percentages in suburban (33%) and rural (36%) areas (figure 2).
- Similar to overall property victimization, a lower percentage of other theft victimizations were reported to police in urban areas (20%) compared to suburban (28%) and rural (31%) areas.
Note: See appendix table 1 for estimates and standard errors.
*Comparison group.
†Difference with comparison group is significant at the 95% confidence level.
aLabeled household burglary in prior reports. Includes unlawful, forcible, or attempted entry of places, including a permanent residence, other residence (e.g., a hotel room or vacation residence), or other structure (e.g., a garage or shed). Includes victimizations where the offender stole, attempted to steal, or did not attempt to steal. Excludes trespassing on land.
bIncludes other unlawful taking or attempted unlawful taking of property or cash without personal contact with the victim.
cAll census blocks within cities or U.S. Census Bureau-designated places that meet certain criteria based on their population and density. See Methodology in Criminal Victimization, 2019 (NCJ 255113, BJS, September 2020).
dAll other census blocks not classified as urban or rural.
eAll census blocks not in U.S. Census Bureau-defined urbanized areas or urban clusters.
Source: Bureau of Justice Statistics, National Crime Victimization Survey, 2020–2023.
Methodology
The data used to produce the statistical estimates in this report are from the National Crime Victimization Survey (NCVS), the nation's primary source of information on criminal victimization occurring in the United States. Data are obtained annually from a nationally representative sample of U.S. households, and persons age 12 or older are interviewed on the frequency, characteristics, and consequences of criminal victimization. For more information on the NCVS, see Methodology in Criminal Victimization, 2023 (NCJ 309335, BJS, September 2024).
This report presents estimates for the aggregate period of 2020 through 2023. This approach increases the reliability and stability of the estimates, which facilitates comparisons between subgroups.
For the NCVS, classifications of urban, suburban, and rural areas are made at the household level and are based on where the victim lives, as opposed to where the crime incident took place. The definition of these areas in the NCVS was updated in 2019. A place is categorized as urban if census blocks within cities or U.S. Census Bureau-designated places meet certain criteria based on their population and density. The NCVS defines rural as places not in U.S. Census Bureau-defined urbanized areas or urban clusters. Suburban areas are places not classified as urban or rural. For more information on the classification of urban, suburban, and rural areas, see Methodology in Criminal Victimization, 2019 (NCJ 255113, BJS, September 2020).
For specific question wording, please see the 2023 NCVS Crime Incident Report questionnaire. Data used, including data documentation, are archived at the National Archive of Criminal Justice Data and are available for public use. More information on downloading the NCVS public-use data in this report can be found here.
Urban*a | Suburbanb | Ruralc | |||||
| Estimate | Standard error | Estimate | Standard error | Estimate | Standard error | |
| Total violent victimizationsd | 38.4% | 1.95% | 42.5%‡ | 1.19% | 51.0%† | 2.22% | |
Rape/sexual assaulte | 13.5 | 3.80 | 29.1† | 2.85 | 52.4† | 7.22 | |
Robbery | 63.0 | 4.60 | 49.0† | 3.03 | 72.8 | 6.18 | |
Aggravated assault | 49.8 | 4.32 | 56.0 | 2.31 | 56.2 | 4.09 | |
| Simple assault | 32.3 | 2.59 | 39.0† | 1.55 | 46.0† | 3.02 | |
| Total property victimizations | 25.1% | 0.98% | 32.6%† | 0.67% | 36.1%† | 1.48% | |
| Burglary/trespassingf | 41.8 | 2.70 | 42.6 | 1.37 | 43.8 | 2.58 | |
Motor vehicle theft | 72.7 | 3.65 | 76.5 | 1.94 | 81.4 | 4.85 | |
| Other theftg | 20.4 | 0.92 | 27.9† | 0.65 | 31.4† | 1.54 | |
*Comparison group.
†Difference with comparison group is significant at the 95% confidence level.
‡Difference with comparison group is significant at the 90% confidence level.
aAll census blocks within cities or U.S. Census Bureau-designated places that meet certain criteria based on their population and density. See Methodology in Criminal Victimization, 2019 (NCJ 255113, BJS, September 2020).
bAll other census blocks not classified as urban or rural.
cAll census blocks not in U.S. Census Bureau-defined urbanized areas or urban clusters.
dIncludes rape or sexual assault, robbery, aggravated assault, and simple assault. Excludes homicide because the National Crime Victimization Survey (NCVS) is based on interviews with victims.
eSee Methodology in Criminal Victimization, 2023 (NCJ 309335, BJS, September 2024) for details on the measurement of rape or sexual assault in the NCVS.
fLabeled household burglary in prior reports. Includes unlawful or forcible entry or attempted entry of places, including a permanent residence, other residence (e.g., a hotel room or vacation residence), or other structure (e.g., a garage or shed). Includes victimizations where the offender stole, attempted to steal, or did not attempt to steal. Excludes trespassing on land.
gIncludes other unlawful taking or attempted unlawful taking of property or cash without personal contact with the victim.
Source: Bureau of Justice Statistics, National Crime Victimization Survey, 2020–2023.
The Bureau of Justice Statistics of the U.S. Department of Justice is the principal federal agency responsible for measuring crime, criminal victimization, criminal offenders, victims of crime, correlates of crime, and the operation of criminal and civil justice systems at the federal, state, tribal, and local levels. BJS collects, analyzes, and disseminates reliable statistics on crime and justice systems in the United States, supports improvements to state and local criminal justice information systems, and participates with national and international organizations to develop and recommend national standards for justice statistics. Kevin M. Scott, PhD, is the acting director.
This report was written by Miles Wang and Alexandra Thompson. Rebecca Bielamowicz, PhD, verified the report.
Joshua Hickman edited the report. Jeffrey Link and Priscilla M. Fauntleroy produced this report.
July 2025, NCJ 310166


