Suzanne M. Strong, PhD
BJS Statistician
Download PDF (1.6M)
January 2024, NCJ 307823
The federal pretrial process includes an initial hearing to determine whether to release or detain a person charged with a crime pending trial.1 This report details trends in the federal pretrial release process during the coronavirus (COVID-19) pandemic.
Key Findings
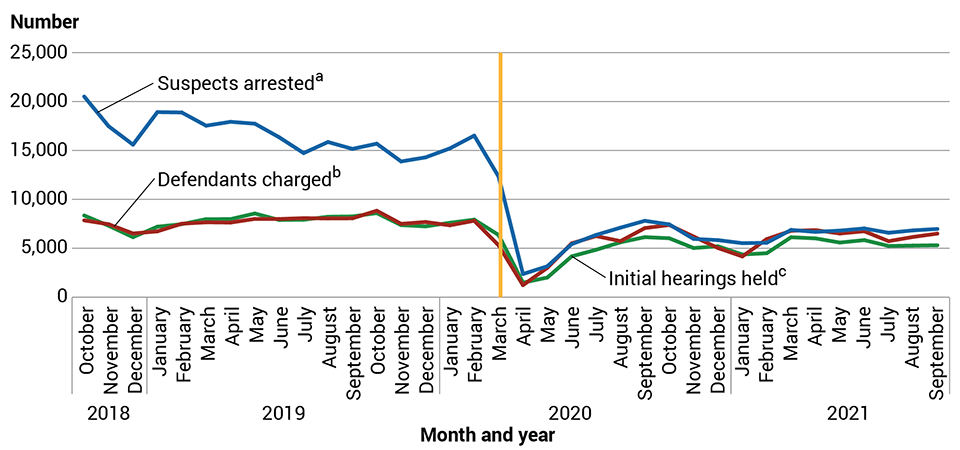
After fluctuating monthly between 7,200 and 8,600 in 2019 and early 2020, the number of initial hearings began to decline around March 2020, reaching a low in April 2020 (figure 1). This decrease coincides with decreases during this period in the number of people arrested and charged.
The number of initial hearings increased between May and September 2020 before declining again. Beginning in March 2021, the number of initial hearings increased to levels similar to that in September 2020, remaining above 5,000 for the remainder of the fiscal year. The number of initial hearings prior to March 2020 peaked in October 2019 at 8,594 hearings. After March 2020, the number of initial hearings peaked in September 2020 at 6,138.
Figure 1. Initial hearings for cases initiated in federal district courts, fiscal years 2019–2021
Note: The gold line at March 2020 signifies the beginning of the COVID-19 pandemic in the United States. Annual data are for the fiscal year, which is from October 1 to September 30. See appendix table 1 for details.
aSuspects arrested by federal law enforcement. Each arrest is counted separately, so persons with more than one arrest are counted more than once. Excludes District of Columbia Superior Court arrests. For 2020 and 2021 arrests, the custody start date is used instead of the arrest date (as in prior years) because not all bookings in 2020 and 2021 had arrest dates, due to the U.S. Marshals Service’s transition to a new data system. The custody date is used to ensure all bookings are enumerated, including records that are missing an arrest date.
bDefendants charged with a felony or a misdemeanor offense in U.S. district court. Defendants charged in more than one case are counted separately.
cExcludes District of Columbia Superior Court cases, pretrial diversions, dismissals, and transfers out. Differences between numbers reported by BJS and official numbers reported by the Administrative Office of the U.S. Courts (AOUSC) may be due to data processing differences between BJS and AOUSC.
Source: Bureau of Justice Statistics, based on data from the U.S. Marshals Service, CAPTURE information system; Executive Office for U.S. Attorneys, National Legal Information Office Network System database, fiscal years 2019–2021: Administrative Office of the U.S. Courts (AOUSC), Criminal Master File; and AOUSC Office of Probation and Pretrial Services Automated Case Tracking System, fiscal years 2019–2021.
Download CSV (4K)
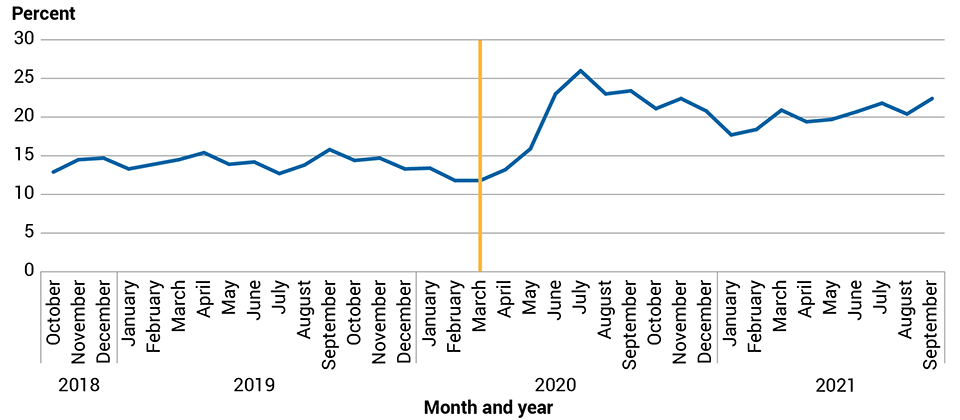
From October 2018 to March 2020, the percent of persons released at initial hearing each month ranged from 12% to 15% (figure 2). This percentage increased from March to July 2020, where it peaked at 26%. The percentage of persons released each month ranged from 18% to 23%, beginning in June 2020 and continuing through September 2021.
Figure 2. Persons released at initial hearings for cases initiated in federal district courts, fiscal years 2019–2021
Note: Excludes District of Columbia Superior Court cases, pretrial diversions, dismissals, and transfers out. The gold line at March 2020 signifies the beginning of the COVID-19 pandemic. Differences between numbers reported by BJS and official numbers reported by the Administrative Office of the U.S. Courts (AOUSC) may be due to data processing differences between BJS and AOUSC. Annual data are for the fiscal year, which is from October 1 to September 30. See appendix table 2 for details.
Source: Bureau of Justice Statistics, based on data from the AOUSC Office of Probation and Pretrial Services Automated Case Tracking System, fiscal years 2019–2021.
Download CSV (3K)
Pretrial Release Measures
These findings are based on data from the Probation and Pretrial Services Office, Administrative Office of the U.S. Courts (AOUSC), and are provided to the Bureau of Justice Statistics’ (BJS) Federal Justice Statistics Program (FJSP). The FJSP collects data from the U.S. Marshals Service, Drug Enforcement Administration, Executive Office for U.S. Attorneys, Administrative Office of the U.S. Courts, U.S. Sentencing Commission, and Federal Bureau of Prisons and provides annual data on workload, activities, and outcomes associated with federal criminal cases. Probation and Pretrial Services collects information on the pretrial release of defendants charged in federal district courts, including the type and timing of release or detention. Data provided to the FJSP included records for defendants whose cases were initiated in federal district courts for fiscal years 2019 through 2021. Numbers reported by BJS may not align with numbers reported by AOUSC due to data processing differences. For more information about how FJSP data are compiled, see the Methodology section in Federal Justice Statistics, 2021 (NCJ 305127, BJS, December 2022).
Year | Month | Suspects arresteda | Defendants chargedb | Number of initial hearingsc |
|---|---|---|---|---|
2018 | October | 20,505 | 7,850 | 8,348 |
| November | 17,471 | 7,457 | 7,303 |
| December | 15,590 | 6,512 | 6,135 |
2019 | January | 18,915 | 6,729 | 7,203 |
| February | 18,880 | 7,508 | 7,464 |
| March | 17,528 | 7,654 | 7,976 |
| April | 17,924 | 7,628 | 7,978 |
| May | 17,732 | 8,001 | 8,552 |
| June | 16,340 | 7,991 | 7,892 |
| July | 14,728 | 8,078 | 7,917 |
| August | 15,859 | 8,050 | 8,221 |
| September | 15,158 | 8,062 | 8,253 |
| October | 15,687 | 8,834 | 8,594 |
| November | 13,872 | 7,496 | 7,367 |
| December | 14,288 | 7,684 | 7,236 |
2020 | January | 15,205 | 7,347 | 7,606 |
| February | 16,511 | 7,814 | 7,924 |
| March | 12,325 | 5,300 | 6,354 |
| April | 2,369 | 1,232 | 1,487 |
| May | 3,157 | 3,006 | 2,009 |
| June | 5,426 | 5,507 | 4,175 |
| July | 6,361 | 6,245 | 4,847 |
| August | 7,105 | 5,729 | 5,612 |
| September | 7,806 | 7,062 | 6,138 |
| October | 7,441 | 7,378 | 6,023 |
| November | 5,955 | 6,197 | 5,025 |
| December | 5,832 | 5,027 | 5,203 |
2021 | January | 5,520 | 4,167 | 4,362 |
| February | 5,562 | 5,935 | 4,494 |
| March | 6,877 | 6,786 | 6,127 |
| April | 6,673 | 6,854 | 6,009 |
| May | 6,804 | 6,508 | 5,584 |
| June | 7,022 | 6,741 | 5,834 |
| July | 6,585 | 5,724 | 5,234 |
| August | 6,826 | 6,156 | 5,272 |
| September | 6,971 | 6,499 | 5,306 |
aSuspects arrested by federal law enforcement. Each arrest is counted separately, so persons with more than one arrest are counted more than once. Excludes District of Columbia Superior Court arrests. For 2020 and 2021 arrests, the custody start date is used instead of the arrest date (as in prior years) because not all bookings in 2020 and 2021 had arrest dates, due to the U.S. Marshals Service’s transition to a new data system. The custody date is used to ensure all bookings are enumerated, including records that are missing an arrest date. Download CSV (4K) | ||||
Year | Month | Number of initial hearings | Number of persons released at initial hearings | Percent of persons released at initial hearings |
2018 | October | 8,348 | 1,079 | 12.9% |
| November | 7,303 | 1,061 | 14.5 |
| December | 6,135 | 899 | 14.7 |
2019 | January | 7,203 | 958 | 13.3% |
| February | 7,464 | 1,040 | 13.9 |
| March | 7,976 | 1,153 | 14.5 |
| April | 7,978 | 1,228 | 15.4 |
| May | 8,552 | 1,188 | 13.9 |
| June | 7,892 | 1,123 | 14.2 |
| July | 7,917 | 1,008 | 12.7 |
| August | 8,221 | 1,136 | 13.8 |
| September | 8,253 | 1,301 | 15.8 |
| October | 8,594 | 1,238 | 14.4 |
| November | 7,367 | 1,083 | 14.7 |
| December | 7,236 | 961 | 13.3 |
2020 | January | 7,606 | 1,019 | 13.4% |
| February | 7,924 | 937 | 11.8 |
| March | 6,354 | 749 | 11.8 |
| April | 1,487 | 197 | 13.2 |
| May | 2,009 | 319 | 15.9 |
| June | 4,175 | 959 | 23.0 |
| July | 4,847 | 1,259 | 26.0 |
| August | 5,612 | 1,291 | 23.0 |
| September | 6,138 | 1,439 | 23.4 |
| October | 6,023 | 1,273 | 21.1 |
| November | 5,025 | 1,128 | 22.4 |
| December | 5,203 | 1,084 | 20.8 |
2021 | January | 4,362 | 774 | 17.7% |
| February | 4,494 | 829 | 18.4 |
| March | 6,127 | 1,280 | 20.9 |
| April | 6,009 | 1,166 | 19.4 |
| May | 5,584 | 1,099 | 19.7 |
| June | 5,834 | 1,206 | 20.7 |
| July | 5,234 | 1,140 | 21.8 |
| August | 5,272 | 1,077 | 20.4 |
| September | 5,306 | 1,188 | 22.4 |
Note: Excludes District of Columbia Superior Court cases, pretrial diversions, dismissals, and transfers out. Differences between numbers reported by BJS and official numbers reported by the Administrative Office of the U.S. Courts (AOUSC) numbers may be due to data processing differences between BJS and AOUSC. The number and percent of persons are based on person-cases; if one person has two cases, they would appear twice in the data. Download CSV (3K) | ||||
__________________
1The federal pretrial process begins with an initial hearing within 24 hours of a person’s arrest. At this hearing, the judge decides to release or detain the person pending trial; if the judge does not have enough information to make this determination, the judge will schedule a detention hearing. See Initial Hearing/Arraignment for more information.
The Bureau of Justice Statistics of the U.S. Department of Justice is the principal federal agency responsible for measuring crime, criminal victimization, criminal offenders, victims of crime, correlates of crime, and the operation of criminal and civil justice systems at the federal, state, tribal, and local levels. BJS collects, analyzes, and disseminates reliable statistics on crime and justice systems in the United States, supports improvements to state and local criminal justice information systems, and participates with national and international organizations to develop and recommend national standards for justice statistics. Kevin M. Scott, PhD, is the acting director.
This report was written by Suzanne M. Strong, PhD. George E. Browne verified the report.
Maureen Stuart and Brigit Baron edited the report. Priscilla Fauntleroy produced the web version of this report.
January 2024, NCJ 307823


